10 Jun OIL IS HERE TO STAY – SO LET’S ANALYZE IT PROPERLY
OIL IS HERE TO STAY – SO LET’S ANALYZE IT PROPERLY
The spike in oil prices following the tragic events in Ukraine suggests that the world is not yet in a position to abandon fossil fuels. Many small producers are being encouraged to over-hedge to gain finance because they are hedging their gross production not their after tax, royalty, profit share production stream. Liz explains how it works. So, oil companies are being encouraged to invest in the very fossil fuels that are at the same time being phased out by international policy initiatives.
While fossil fuels remain a large part of the energy mix rigorous analysis of project economics has never been more important. The cost structure of oil field developments is analysed thoroughly and routinely. But the revenue stream has not historically been subjected to the same rigour.
This is where Consilience’s new Revenue Analysis, Apportionment and Hedging (RAAH) software application comes in.
Would you like a personal Zoom introduction and demonstration from Liz Bossley. CEO of Consilience? Contact us HERE for a no-obligation or pressure demonstration for you and/or your colleagues.
Please leave us a message and we will be in touch via email.
Joining in the effort to mitigate climate change, the oil majors are transitioning towards a net-zero carbon emissions target by divesting mature or marginal oil field assets. Companies with less public recognition are picking up the discarded assets. Harbour, Enquest, Ineos, Neo Energy, Spirit Energy, Verus and Waldorf, to name but a few, are companies that feature in the rollcall of companies acquiring upstream oil assets.
Traders such as Vitol, Glencore, Trafigura and Mercuria, who have a long history of buying and selling produced oil, have also been moving up the supply chain to acquire oil in the ground.
The National Oil Companies (NOCs) are not ready to relinquish a natural resource, which, for some, is all that stands between their population and penury.
Facing fears of peak oil supply in the 1970s and 1980s, Saudi Sheikh Yamani is reported to have said
“The stone age didn’t end because we ran out of stone.”
Now in the 2020s, facing potential peak oil demand, despite the prospect of adding 2 billion to the world population by 2050, it is as well to remember that, in fact…
the stone age didn’t end..
We still use stone extensively: we just use it more sparingly and more cleverly. So will it be with oil.
As part of the strategy to apply more rigour to decisions to acquire and develop oil fields, a greater focus on the revenue stream arising from oil production is needed.
Revenue Analysis, Apportionment and Hedging (RAAH)
RAAH is an easy-to-use analytical tool designed to help crude oil producers and oil asset buyers and sellers to evaluate their producing and developing oil field projects based on varying production forecasts, different price assumptions and in a wide range of royalty, cost recovery, profit sharing and tax regimes.
RAAH is not based on any one specific country’s petroleum legislation, but includes the components of the production sharing contracts that are encountered repeatedly around the world- royalty paid in cash or in-kind, cost recovery, profit sharing with the government or NOC, petroleum tax and corporation/profit tax.
This software allows the user to tailor the analysis to its own situation by inputting appropriate assumptions for each project. This encourages the user to focus on the assumptions it is making about the project and highlights the consequences if these assumptions turn out to be wrong.
RAAH provides a template to evaluate up to 20 separate oil field projects over a 20-year period, divided into calendar quarters, based on different:
- production forecasts;
- benchmark prices and price differentials;
- royalty in kind or royalty in cash assumptions;
- cost recovery status, i.e. whether or not “payback” of exploration and development costs has been achieved;
- annual government caps on cost recovery;
- government or national oil company profit-sharing percentages;
- petroleum tax assumptions; and,
- corporation or profit tax assumptions.
Follow the Money Using Consilience’s RAAH Software Application
Would you like a personal Zoom introduction and demonstration from Liz Bossley. CEO of Consilience? Contact us HERE for a no-obligation or pressure demonstration for you and/or your colleagues.
Please leave us a message and we will be in touch via email.
Analyzing and managing revenue streams comes as second nature to the large trading companies but is less familiar territory to the small exploration and production (E&P) companies. Such companies tend to focus on costs where they feel they have more control, than the revenue stream, where they often feel they are price takers at the mercy of the market.
Even when their financiers insist that the future revenue stream is hedged to underwrite debt repayments, the amount of hedging that is appropriate to an asset or to the company acquiring or developing the asset is often under-analyzed. At best the E&P companies may be missing a trick; at worst, they can end up with inappropriate hedges that do not match their retained revenue stream once royalty, cost recovery, government profit share and tax are taken into account.
RAAH shows the user how its input assumptions fit together to determine how much hedging has to be undertaken to protect its retained revenue stream and underwrite loan financing.
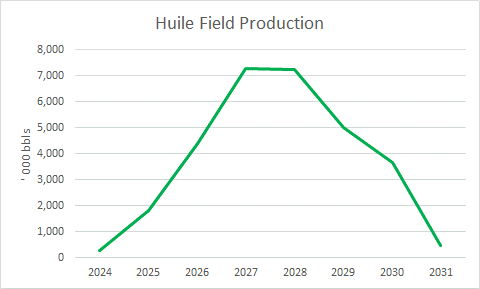
For example, if a fictitious small field, we’ll call it Huile, is expected to produce at peak 20,000 b/d over a 7-year time horizon, the production profile might look something like Chart One.
Chart One: Example Huile-The Basic Field Production Profile
The Production Sharing Building Blocks
The amount of hedging that it would be appropriate for the producer to undertake will vary with its assumptions about how much royalty, in cash or in kind, it will be expected to pay, how fast it is allowed to recover it development costs, what profit share percentage of production the government will take and how soon after start up, whether or not any special petroleum tax will be levied on production and the rate at which standard corporation/ company tax (CT) is applied to the sales revenue from the remainder inside the field’s cost and revenue “ring fence” (IRF).
The blueprint for these parameters is typically set down in some form of Production Sharing Agreement (PSA) that is signed between the company, or joint venture group of companies, and the host country government usually as early as when the license to explore for oil is granted.
These basic building blocks, while not universal, feature regularly in PSAs in oil producing countries as far apart as Latin America, Africa, the Far East and Eurasia. How and when they are combined makes a substantial difference to the amount of sales revenue a producing company is permitted to retain and how much it should hedge.
Like with Lego building blocks, imaginative variations in the PSA components applied by the host government or NOC, affect the comparison of how investors regard competing countries as potential beneficiaries of their exploration dollars. RAAH allows the user to fit its Lego blocks together quickly and easily in different combinations to see what answers emerge about the revenue stream of the project.
PSA regimes typically cap the amount of costs that the investing company is permitted to recover in any given year to ensure that the indigenous population receives some benefit from oil production at the earliest opportunity.
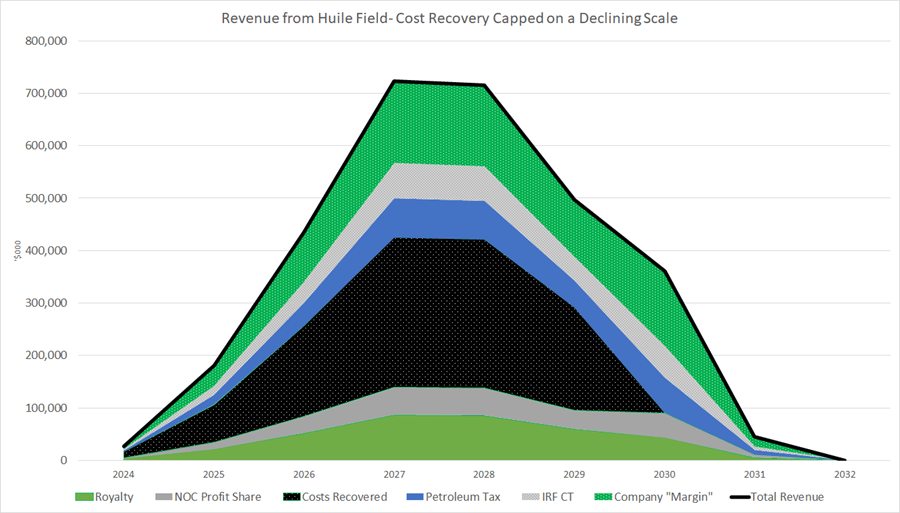
For example, take our fictitious example of the Huile Field, all else being equal, if the producing company were to be permitted to recover its costs from up to, say, 45% the revenue from the sale of production after royalty, which is typically taken before the company is permitted to recover its costs, the company could delay having to give the NOC its profit share, or pay any special petroleum or other taxes until the payback of all its costs had been achieved. (See Chart Two.) In this example, it is assumed that cost recovery payback is achieved in 2030.
Chart Two: 45% Cap on Cost Recovery- Total Cost Payback in 2030
The Ring of Confidence
It is evident that the more costs the company can import to the project, the longer it can keep the NOC waiting for its profit share and other taxes. Consequently, oil fields or projects are typically ring-fenced to keep unrelated costs out thereby ensuring that payback of all costs is not delayed indefinitely. Host governments may choose to permit the importing of exploration and/or development costs from other projects as an added inducement to foreign investment. But, otherwise, what costs can and cannot be recovered is policed avidly by the NOC or other host government revenue authority.
Dole Out the Barrels
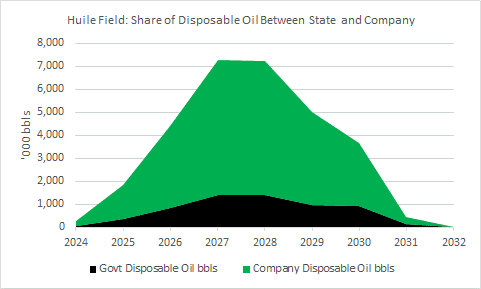
The government is typically entitled to a share of production after the company recovers it costs and pays its royalty. If the state elects to take Royalty in Kind (RIK), rather than in cash, this will increase the number of barrels that the state is entitled to lift and sell on its own behalf and deplete the number of barrels available to the producing company. (See Chart Three) RAAH calculates this in an instant.
This will have consequences for the scheduling of cargo loadings envisaged by any Lifting Agreement that will have been signed by the state and the joint venture companies in the field, or other fields that use the same loading terminal.
Chart Three: The Apportionment of Barrels between the Company and the State
If the state elects to take Royalty in Cash (RIC) the company will in effect sell the government’s royalty barrels for it and remit the proceeds to the state through the royalty taxation system. But there may still be an impact on the apportionment of barrels between the company and the state. This is because the NOC may have very different ideas of what the oil that is produced from a particular field is worth and may challenge the sales prices reported by the producing company.
OSP and the Company’s Actual Sales Price
It is not unusual to see NOCs publishing an official selling price (OSP), often on a quarterly basis. This is usually the price at which RIC is valued, costs are recovered, NOC profit share is calculated, and special petroleum and other taxes are levied. This OSP may be very different from the price the company receives, or claims it receives, when it actually sells the oil to a third party.
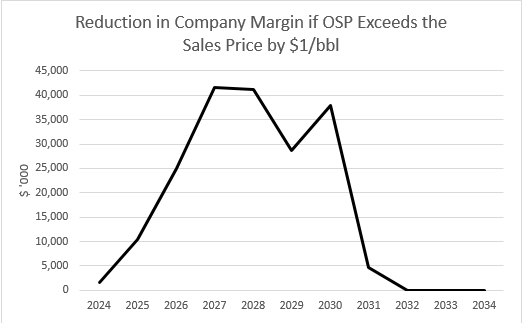
RAAH allows the user to calculate easily and rapidly that if, for example, this difference between the actual sales price and the price the state determines that the producing company ought to have achieved, were to be, say, $1/bbl then the impact on the amount of revenue generated by the field that the company would be allowed to retain would be significant. (See Chart Four). In our example of the Huile field, at peak the company could retain about $40 million less of the revenue generated from its sales than would be the case if the OSP matched the company’s sales price exactly.
This sets up a tension between the company and the state with the former arguing for lower OSPs and the latter arguing for higher OSPs. This tension is compounded when the company does not sell its share of the barrels at arm’s length to third parties, but instead refines the oil within its own downstream affiliates.
Chart Four: Reduction in Company Retained Revenue if OSP is $1/bbl higher than the Company’s Sales Price
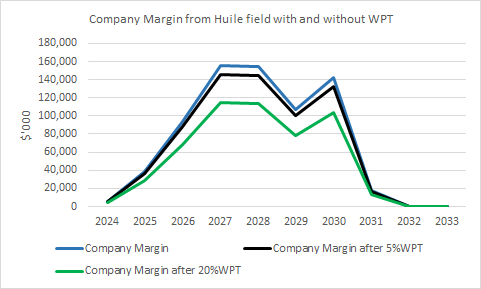
Since Russia invaded Ukraine on 24th February 2022, the price of oil has increased from about $80/bbl at the beginning of the year to a high, so far, of about $125/bbl. Unsurprisingly, this has prompted calls for a Windfall Profit Tax (WPT) on oil companies. RAAH allows the user to assess the impact of any such tax on the revenue stream of oil companies developing or acquiring oil assets. (See Chart Five)
Chart Five: The Impact of a Windfall Profit Tax
WPT is not a new concept. For example, the Crude Oil Windfall Profit Tax Act of 1980 imposed upon US domestic oil producers an excise tax on the windfall profit from the doubling of oil prices after the Iranian revolution. There were different tiers of tax and exemptions for Native American oil, Alaskan oil and certain government entities. One lasting lesson from that episode is that tax needs to be simple. Complex taxes provide the opportunity for producers to develop equally complex tax avoidance strategies.
Debt Financing and Hedges
A more rigorous analysis of the revenue stream that an oil field or project will generate is essential to well-informed decision-making about the development or acquisition of an oil field or project. Pitching to financiers for funding of the oil field development or acquisition, inevitably involves a discussion of whether the revenue stream will be sufficient to service or repay their loan.
At this point the question of hedging the future revenue stream arises. A project whose economics work at $70/bbl may not justify the investment if prices fall to $40 /bbl. So, the financier may insist that the company hedges the future revenue stream in order to underwrite future loan repayments.
Hedge Volume and Hedge Accounting
But what volume of oil precisely should be hedged? If the company and the revenue authority in the host country agree that hedge costs, gains and losses can be brought inside the ring fence (IRF) and that hedge accounting rules should apply, the issue is straightforward: the hedge gains/losses are netted off the sales price achieved by the company for the purposes of royalty, cost recovery, profit share and tax. But it is much more likely that hedges will remain firmly outside the ring fence (ORF), unrecognized by the host government.
This means that if the company hedges 100% of gross production it is effectively hedging the government’s share of the total revenue stream. If prices rise after hedges are put in place the losses that accrue on the hedges ORF are borne by the company alone and the government will not shoulder its share of the burden. This is not surprising because hedges are often too remote from the field or project and may exist within a consolidated book of corporate hedges that may include other projects and often other affiliates.
Consequently, hedging the gross volume of production, as outlined in Chart One above, is too simplistic an approach and will probably result in over-hedging. Companies may wish to hedge only that portion of the revenue stream they will be entitled to retain after the government’s take.
Working out what that portion is going to be requires the more thorough analysis anticipated by RAAH and permits the company’s project analysts to compile a composite percentage of deductions from the revenue stream applied IRF to total production. So, if the company only expects to retain 70% of the revenue stream after deductions, this suggest that only 70% of the gross volume should be hedged.
Some Taxes are more Equal than Others
But there is a further parameter that has to be considered: the unequal tax treatment of revenue from physical sales and profits or losses from hedges. If the oil field or project does not enjoy hedge accounting, then the tax rate that applies to hedge gains/losses ORF may differ from the effective tax rate IRF.
For example, assume 100,000 bbls of Huile production is hedged in advance at $70/bbl, because the company would like to receive $7million of revenue to cover its IRF composite tax of 30%, its operating costs, loan repayments and make a profit. Hence it anticipates retaining $4.9 million of the revenue raised when the oil is sold at a later date and its hedges are closed.
If the sales price down the road on the day the oil is produced is $50/bbl, the physical oil will be sold at $50/bbl and the hedge will have gained $20/bbl, because the hedge sales at $70/bbl is closed by buying back the hedge at $50/bbl. This gives the company a gross revenue outcome of 100,000bbls*($50/bbl+$20/bbl) = $7,000,000. However, after tax the picture is somewhat different.
If the effective composite tax rate IRF is 30% and the tax rate ORF is, say, 15% then the net revenue retained by the company is not the $4.9 million it anticipated. Instead, it is $3.5 million IRF and $1.7 million ORF= $5.2 million. This looks like a nice windfall gain, but if prices had risen by $20/bbl rather than fallen after the hedges were opened at $70 would now be making a loss of $20/bbl and the overall net revenue would have been $6.3 million IRF + a loss of $1.7 million ORF = $4.6 million, which is a shortfall in total after tax revenue of $4.9-4.6 million= $300,000.
To compensate for this unequal tax result, the volume of hedging that should be undertaken has to be scaled for the ratio of retained revenue IRF to the retained revenue ORF. So, in this example, the volume of hedges that should be undertaken is 100,000 bbls x (70/85) =82,353 bbls. Hence, if the price increases after 82,353 bbls of hedges have been opened and the physical cargo of 100,000 bbls is sold, then the overall net revenue retained by the company is $6.3 million IRF + a loss of $1.4 million ORF = $4.9 million. This is the “correct” amount of retained revenue, because it equals what the company expected to retain if it had been able to sell the physical oil at $70/bbl. In the first place, without any hedging
The greater the disparity between the effective IRF tax rate and the ORF tax rate, the larger the impact on the quantity of hedging that is needed to protect the after-tax revenue stream, as illustrated in Table One.
RAAH allows the user to establish instantly what is the field or projects composite IRF rate of deduction from its gross revenue stream. This works out the ratio of retained revenue IRF and ORF at the click of a button and shows the amount of hedging that is implied by this ratio.
Table One: The Scaling Factor with which to Multiply the Physical Volume to Calculate the Hedge Volume Needed
t is evident that, if the tax rate applied to hedges exceeds the effective tax rate that applies to sales of physical volumes, then the amount of hedging that is required is greater than 1:1. This suggests that the company has to undertake more hedges than it anticipates having barrels of physical oil to sell. This does not pass the common sense “smell” test.
Common Sense
This is where common sense needs to be applied rather than following the numbers slavishly. If a company finds itself in a position where it is being more highly taxed on hedging that it is on revenue from the sale of physical production, then it may be well-advised to relocate the trading department or subsidiary responsible for hedging to a lower tax regime.
Similarly, if a company finds that it is necessary to hedge a high proportion of its physical production forecast to guarantee debt financing then it may wish to re-visit the debt: equity balance of its financing. It may even wish to consider if the project is in fact a marginal one and perhaps it may wish to find itself a project that is economic at a lower price level without the obligation to hedge the majority of production.
These are issues that are for determination by the project management team in the context of its broader economic model.
The Purpose of RAAH
The RAAH software tool is designed to ensure that the revenue assumptions that are plugged into the user’s economic model of a field or project have been thought through thoroughly. It allows the user to play around with a wide range of “What if?” scenarios to make sure it has considered the consequences if its assumptions turn out to be wrong.
RAAH generates almost 500 tables and over 250 charts instantaneously when the user inputs data for up to 20 fields over a 20-year period. It also allows users to import data from Microsoft excel to permit rapid input of large blocks of data and to export the resulting outputs to Microsoft excel to permit the user to incorporate RAAH results into other applications


